Module Code: FE5056QA
Module title: Problem Solving – Methods and Analysis
Instructions: There are 2 parts (both mandatory) as below:
- Prepare a research proposal as per given guidelines (60marks)
- Perform data analysis and report your results as per given guidelines (40marks)
Word limit (Total): 2000 words (End-references and appendices are not included in the word count.)
Part 1: Research proposal (60marks)
It should include the following sub-headings:
Title:
This should represent the content of your proposal.
Research topic:
You have to briefly explain your research topic and why it is relevant. It may be a problem which needs a solution or a question which needs an answer or a theory which needs further development.
Literature review:
Discuss the literature relevant to your research topic and reference them (in Harvard format). A minimum of 5 references are needed. Explain how your topic fits in the debate. Explain how your topic will contribute to the existing literature.
Proposed data type and collection techniques:
Explain whether you plan to use primary or secondary data. Also elaborate on the source of the data and the proposed collection techniques which will be used to obtain the data.
Proposed methodology:
Explain your research design, the proposed methodology and the reason for choosing the same
Part 2: Data analysis(40marks)
Using any data analysis tool of your choice, examine the case-study and answer the questions below:
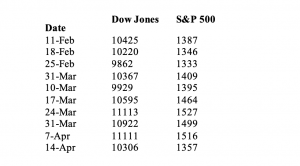
The Dow Jones Industrial Average (DJIA) and the Standard & Poor (S&P) 500 Index are both used as measures of overall movement in the stock market. The DJIA is based on the price movements of 30 large companies; the S&P 500 is an index composed of 500 stocks. Some say the S&P 500 is a better measure of stock market performance because it is broader based. The closing price for the DJIA and the S&P 500 for 10 weeks, beginning with February 11,2000 are shown (Barron’s April 17, 2000)

Note: Consider DJIA as the independent variable
- Develop a scatter diagram for these data and interpret the same.
- Compute the sample correlation coefficient for these data.
- Are they poorly correlated, or do they have a close association?
- Develop the least squares estimated regression equation
- Compute the coefficient of Determination? Would you recommend the regression model for the purpose of estimation?
“You can order FE5056QA Problem Solving Individual assignment from our service and can get a completely high-quality custom paper. Our service offers any of the FE5056QA Academic paper written from scratch, according to all customers’ requirements, expectations and highest standards.”
100% Plagiarism Free
24X7 Customer Support
Multiple Revisions
100% Confidential
On-time Delivery
500+ Experts
